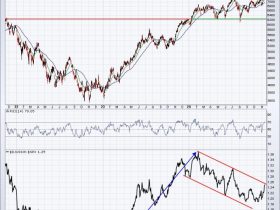
Seasonality Charts: A Powerful Tool for Sector Analysis
Understanding seasonality patterns in different sectors of the stock market can provide valuable insights for investors seeking to make informed decisions. Seasonality charts track historical trends in stock prices over specific periods, allowing investors to identify recurring patterns and trends that may impact sector performance. By analyzing these charts, investors can gain a better understanding of the best sectors to watch at any given time.
One sector that often emerges as a top performer during specific seasons is the technology sector. Tech stocks have historically displayed strong performance during the fourth quarter of the year, as companies release new products and consumers ramp up their spending during the holiday season. This trend is exemplified by the seasonal chart for popular tech companies such as Apple, Microsoft, and Amazon, which often experience price surges during this period.
Similarly, the healthcare sector has also shown seasonal strength during certain times of the year. Biotech stocks, for example, tend to perform well in the first quarter as companies release new drug developments and clinical trial results. By analyzing seasonality charts for key healthcare companies, investors can anticipate potential market movements and position their portfolios accordingly.
Another sector that investors should keep an eye on based on seasonality charts is the consumer discretionary sector. This sector tends to perform well during the summer months when consumer spending typically increases due to vacation season and outdoor activities. Retail stocks, in particular, have historically shown strong performance during this period, as consumers flock to stores and online platforms to make purchases.
On the contrary, some sectors exhibit weaker performance during certain seasons. For example, the energy sector often faces challenges during the first quarter of the year due to factors such as decreased demand for oil and gas products and adverse weather conditions affecting production. By analyzing seasonality charts for energy stocks, investors can identify potential periods of weakness and adjust their investment strategies accordingly.
In conclusion, seasonality charts provide valuable insights into sector performance throughout the year, helping investors make informed decisions about their portfolios. By studying these charts and understanding the patterns and trends that emerge, investors can identify the top sectors to watch at any given time and position themselves strategically in the market. With the right knowledge and analysis, investors can capitalize on seasonal trends and maximize their investment returns in the ever-changing stock market landscape.


