The MACD Histogram: A Powerful Tool for Anticipating Trend Changes
Understanding market trends and predicting changes is a key aspect of successful trading. Traders and analysts alike rely on various technical indicators to guide their decision-making process. One such indicator that holds the potential to anticipate trend changes is the MACD Histogram.
The MACD Histogram, a derivative of the Moving Average Convergence Divergence (MACD) indicator, is a powerful tool that provides valuable insights into the momentum of a financial instrument. It is particularly useful in identifying potential shifts in market sentiment and trend reversals.
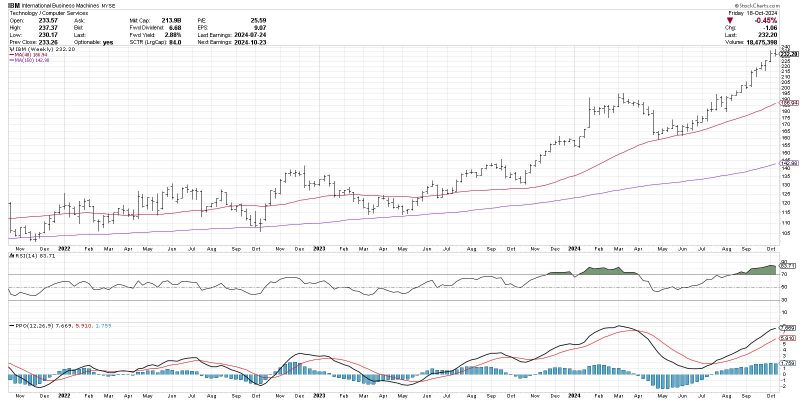
The MACD Histogram is calculated by taking the difference between the MACD line and the signal line. The resulting histogram bars represent the strength of the momentum in a particular direction. When the histogram bars are positive, it indicates bullish momentum, while negative bars signal bearish momentum.
One of the key features of the MACD Histogram is its ability to anticipate potential trend changes. By analyzing the convergence and divergence of the MACD line and signal line, traders can identify shifts in market sentiment before they are reflected in price movements. This early detection of trend changes can provide traders with a strategic advantage in entering and exiting trades at optimal levels.
Traders can utilize the MACD Histogram in conjunction with other technical indicators to confirm trend reversals and strengthen their trading decisions. For example, when the MACD Histogram forms a series of higher highs or lower lows in conjunction with price movements, it can serve as a powerful signal of a potential trend reversal.
Moreover, traders can also look for divergences between the MACD Histogram and price action to identify hidden clues about the future direction of the market. Divergences occur when the MACD Histogram shows a different pattern from price movements, hinting at a possible trend change on the horizon.
In conclusion, the MACD Histogram is a valuable tool for traders seeking to anticipate trend changes and capitalize on market opportunities. By analyzing the strength of momentum and detecting divergences, traders can gain valuable insights into market sentiment and make informed trading decisions. When used in conjunction with other technical indicators, the MACD Histogram can be a powerful ally in navigating the dynamic world of financial markets.


